Financial Analysis of a Portfolio Trading Strategy: A Tryout Version
Exploration of systematic trading strategy to achieve higher risk-adjusted returns
Finance
Portfolio Optimization
Deep Learning
Author
Rushi Desai
Published
November 26, 2024
Overview
This project serves as an initial exploration of a systematic trading strategy tailored to portfolio performance across selected technology stocks. The strategy aims to achieve higher risk-adjusted returns while effectively managing downside risks, contributing to the development of more advanced, automated trading frameworks. Financial analysis metrics such as total return, Sharpe Ratio, Sortino Ratio, and win/loss dynamics are utilized to evaluate the strategy’s performance. The primary goal is to fetch historical stock data, apply technical indicators, and train a machine learning model to predict stock price movements. The strategy is then backtested to evaluate its performance.
Key Components:
1. Data Fetching and Cleaning
The fetch_data function retrieves historical stock data using the yfinance library. It cleans the data by ensuring the necessary columns are present and handling any missing values.
The clean_data function processes the DataFrame to ensure it has the required columns (Open, High, Low, Close, Volume). If any columns are missing, they are filled with the Close price.
2. Technical Indicators
The add_indicators function calculates Exponential Moving Averages (EMAs) for the stock prices, which are used as features for the machine learning model.
3. Machine Learning Model
The train_ml_model function trains a Random Forest Classifier to predict whether the stock price will increase or decrease based on the calculated EMAs and lagged returns.
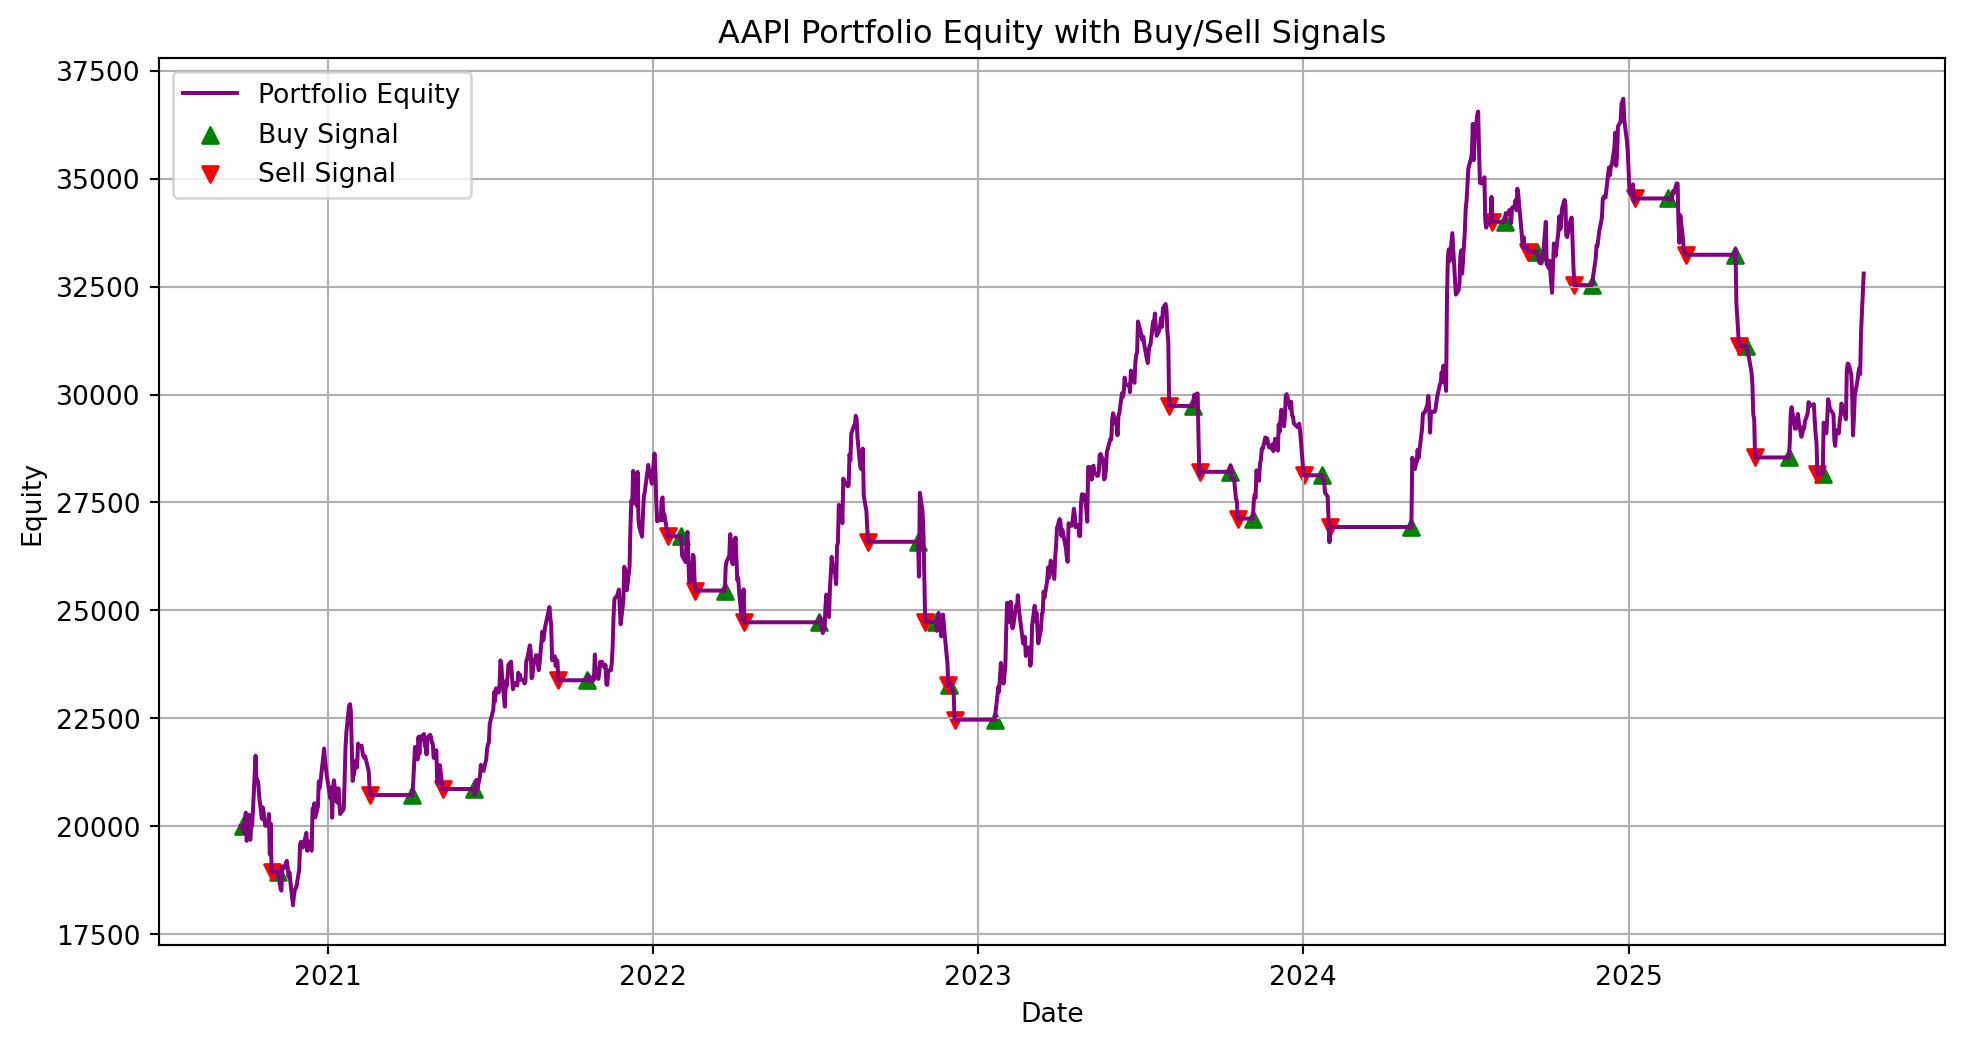
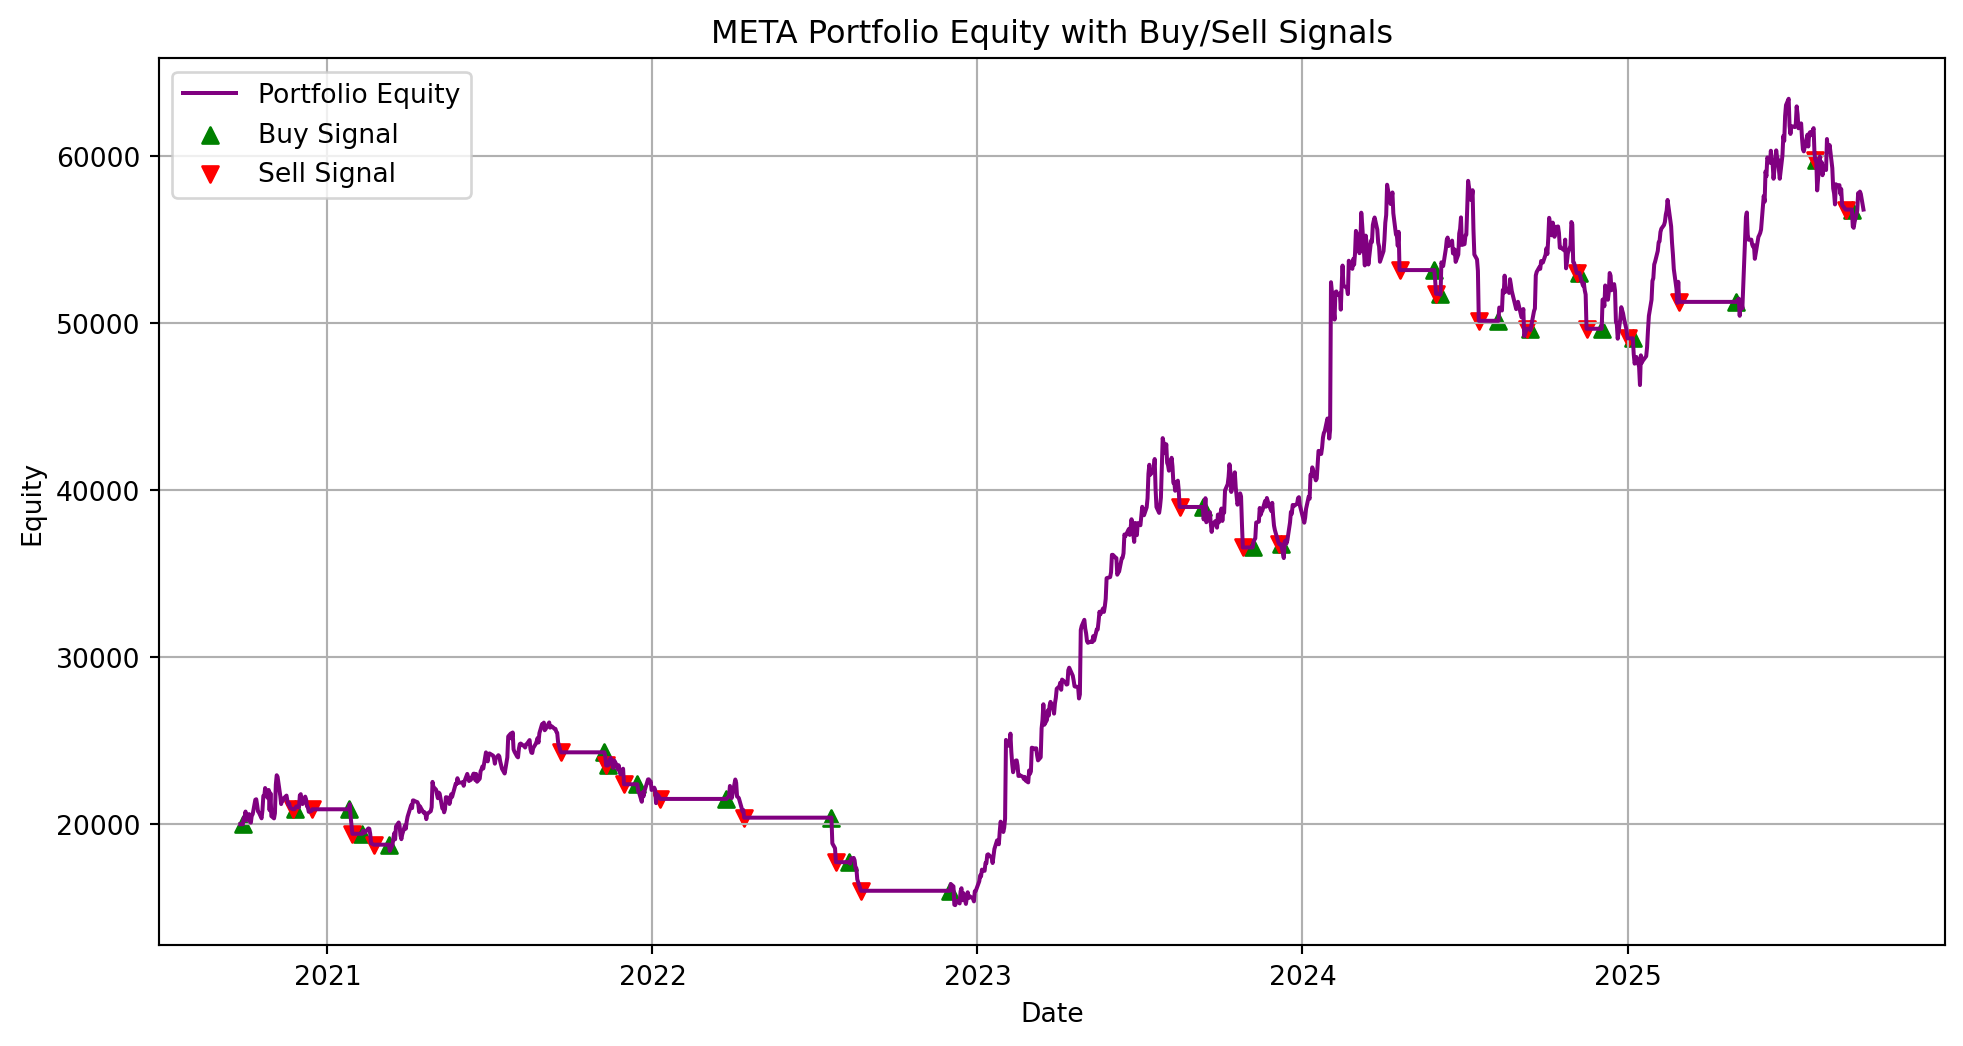
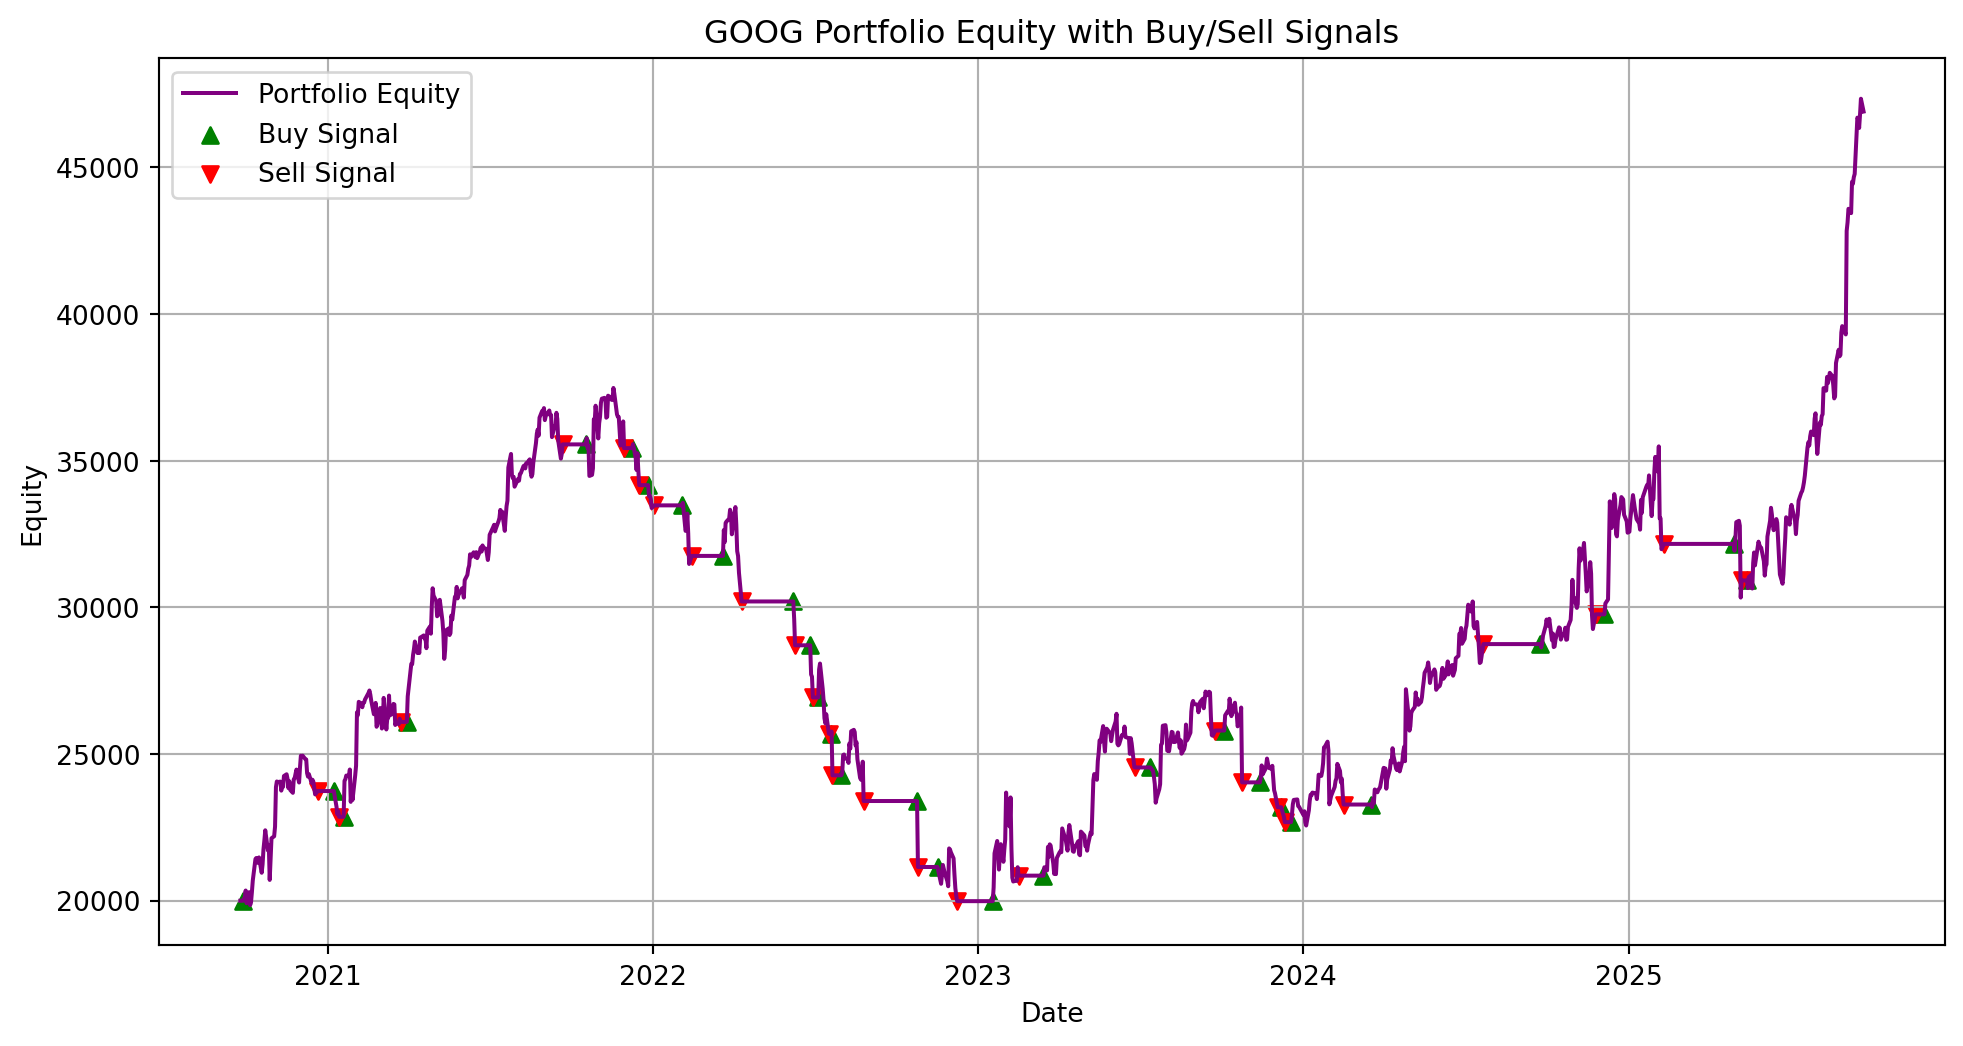
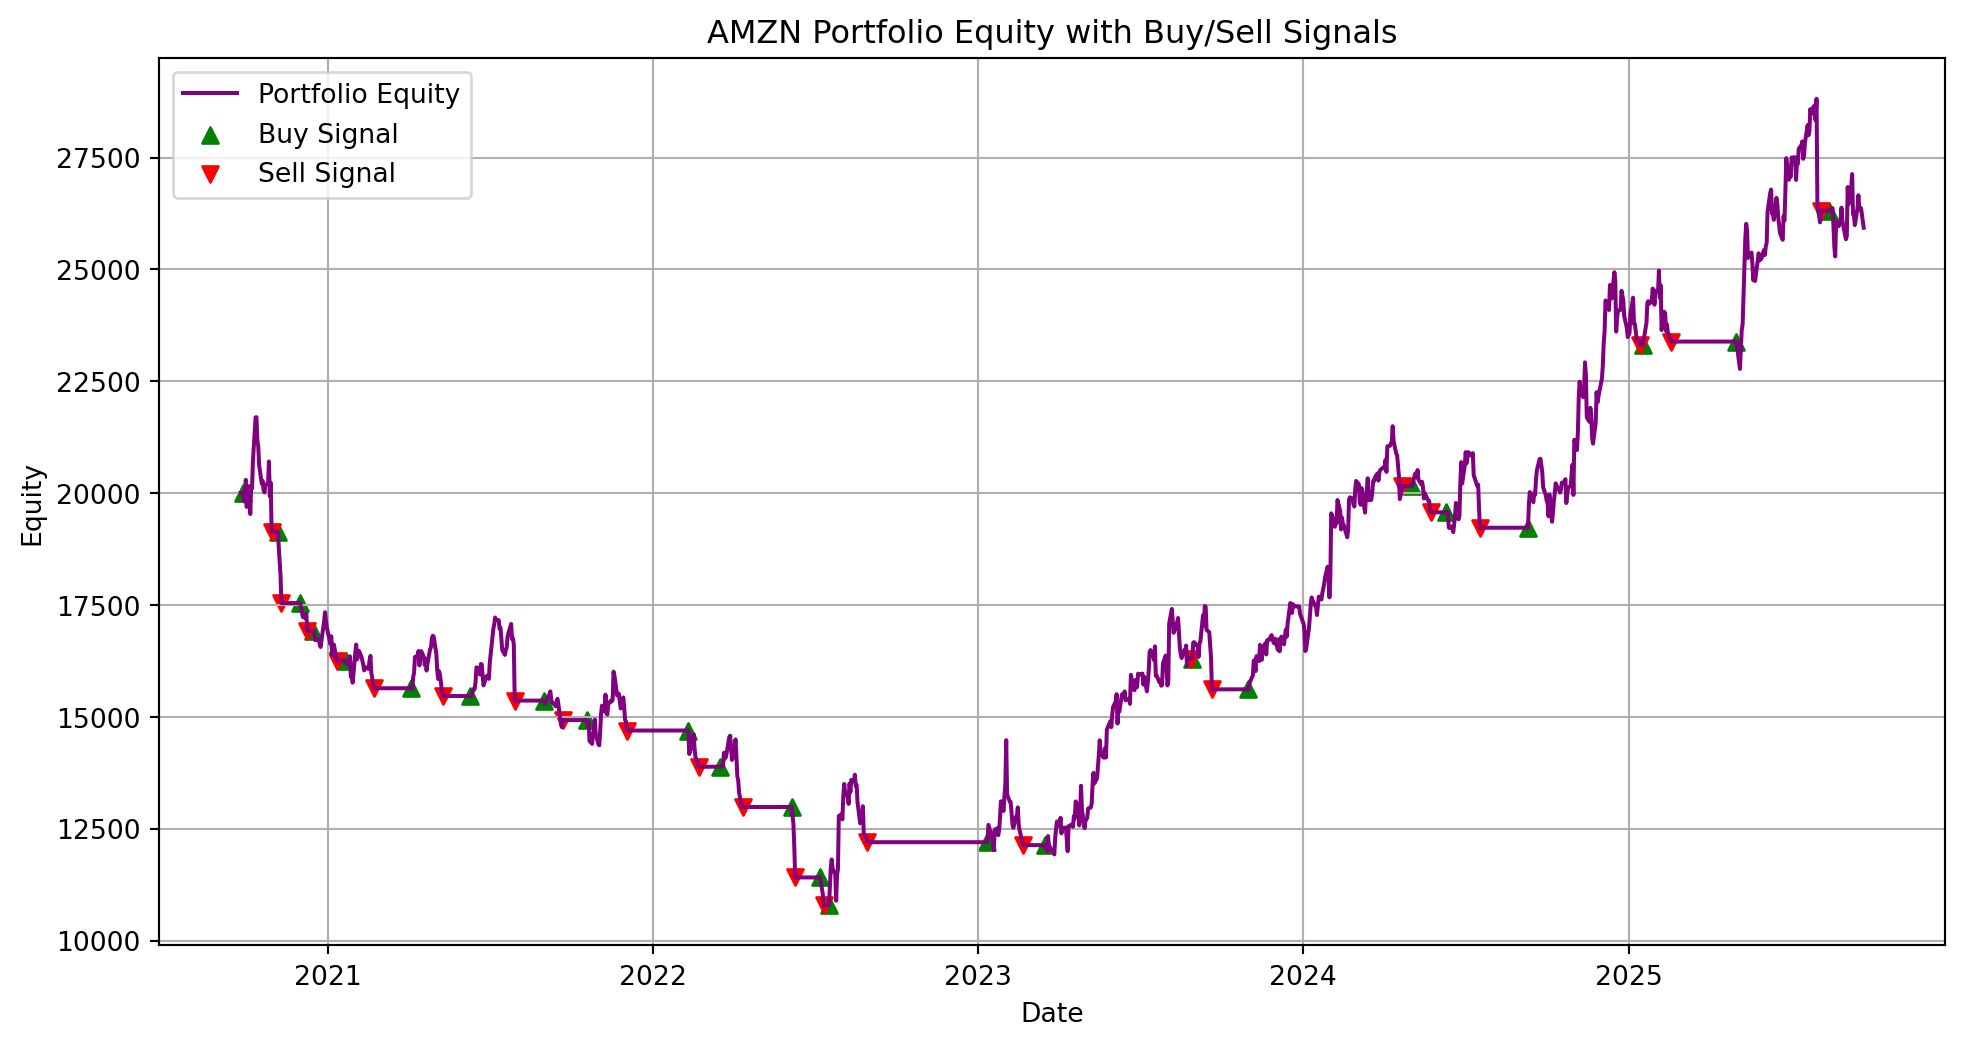
4. Backtesting
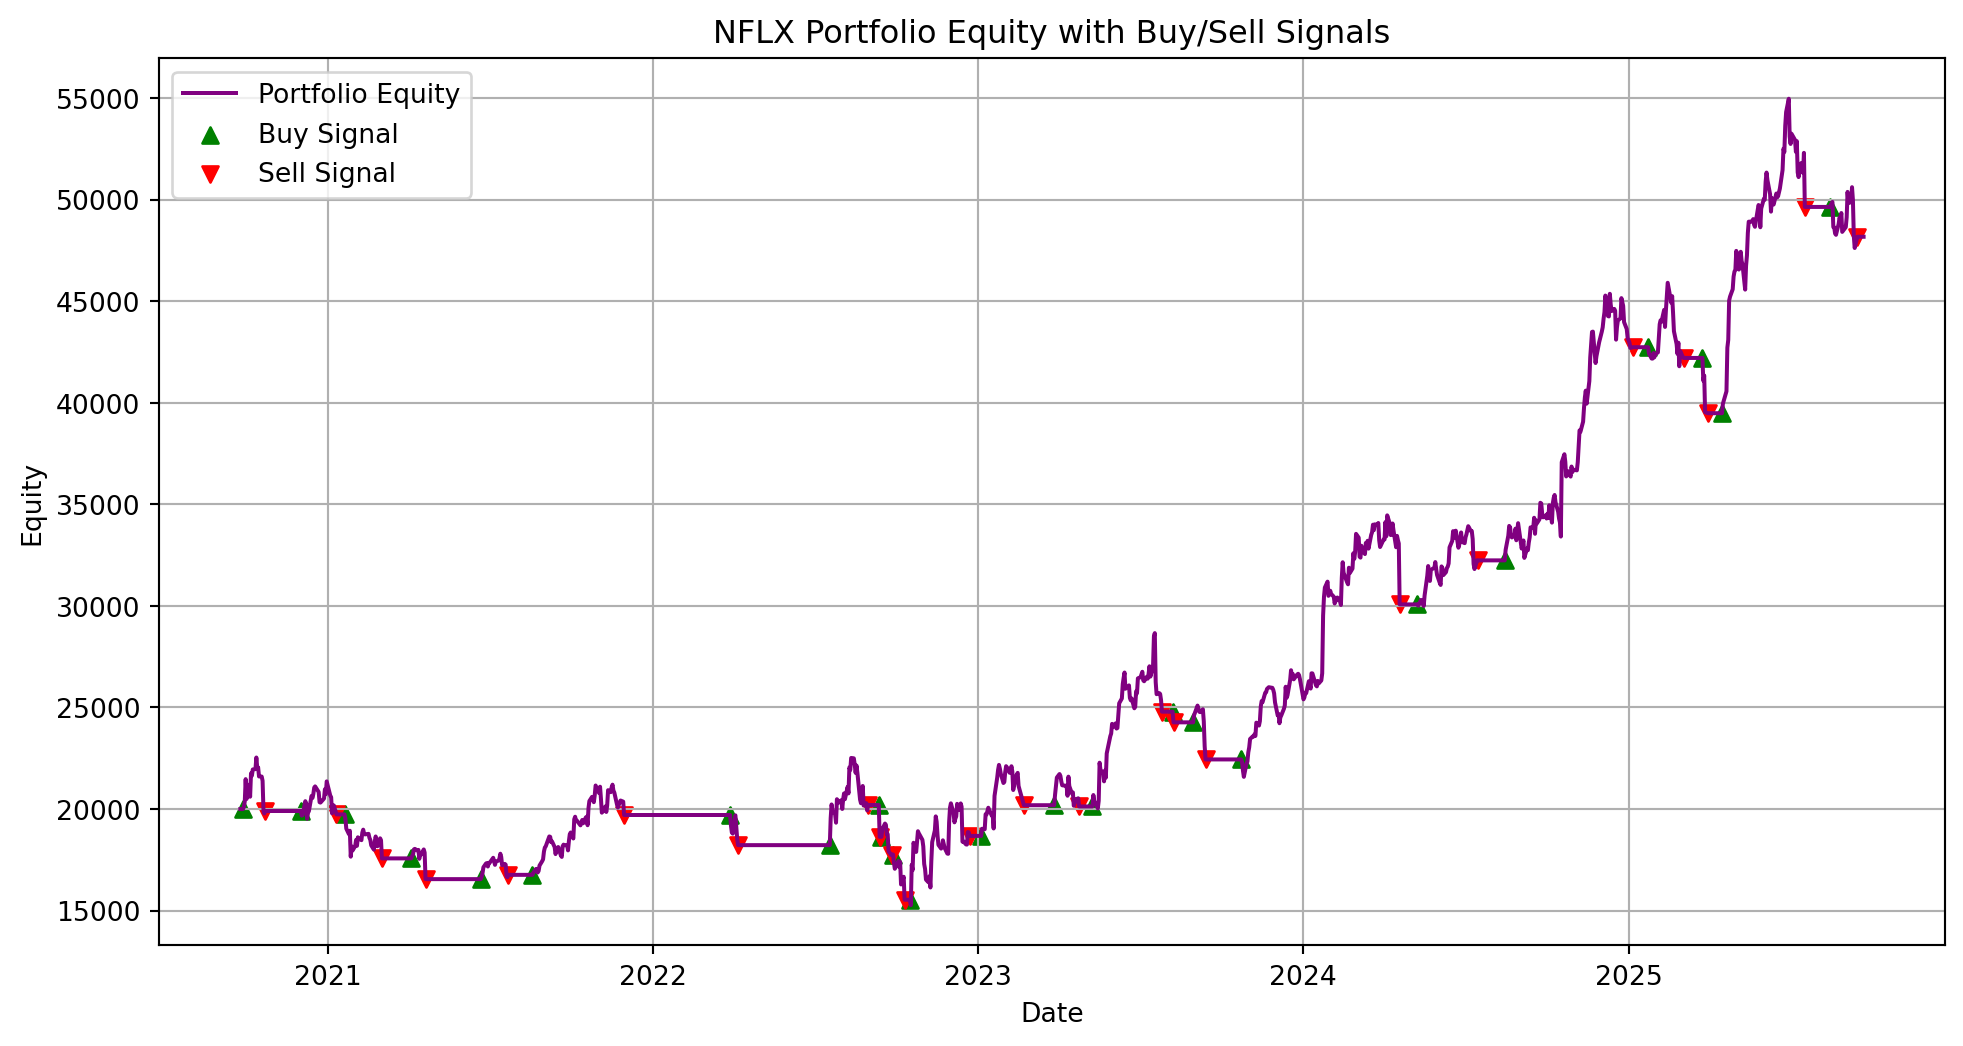
The run_backtest_with_cash function simulates trading based on the model’s predictions, tracking cash balance and portfolio equity over time.
5. Performance Metrics
The performance of the trading strategy is evaluated using various metrics, including total return, win rate, and Sharpe ratio.
Where: - \(\mu\) is the mean of daily returns, - \(\sigma\) is the standard deviation of daily returns, - \(252\) is the number of trading days in a year.
Sortino Ratio
The Sortino ratio, which penalizes only downside risk, is calculated as:
Losses are well-contained, with portfolio drawdowns limited to 3.67% per trade.
Trade Analysis
Best Trades: NFLX delivered a standout return of 10.86%, bolstering portfolio performance.
Worst Trades: META experienced the highest loss of 5.58%, mitigated by overall prudent risk management.
Financial Implications and Model Performance
Alpha Generation
The model consistently outperforms benchmarks, delivering robust alpha through a blend of risk-adjusted returns and effective stock selection.
Portfolio Diversification
Diversified stock-specific contributions—NFLX and GOOG as high-performing assets—offset slower gains from META and AAPL, enhancing portfolio stability.
Market Suitability
High Sortino Ratios highlight the model’s suitability for volatile markets, appealing to risk-averse investors seeking stable returns.
Accuracy
While individual stock prediction accuracy varies (win rates: 37.96% to 46.12%), the weighted portfolio metrics demonstrate reliable predictive and hedging performance.
Opportunities for Strategic Development
Advancing the Model
Algorithm Refinement
Incorporating advanced financial algorithms such as stochastic processes or Monte Carlo simulations to enhance predictability.
Adopting ensemble learning models to refine stock price movement predictions.
Enhanced Data Utilization
Utilizing macroeconomic indicators and alternative data (e.g., social media sentiment, news analytics) to fine-tune portfolio rebalancing and optimize entries/exits.
Risk Monitoring
Introducing advanced metrics like Conditional Value at Risk (CVaR) and Maximum Drawdown to better quantify extreme risks.
Automating hedging strategies like delta-gamma neutralization to minimize volatility impact.
Conclusion
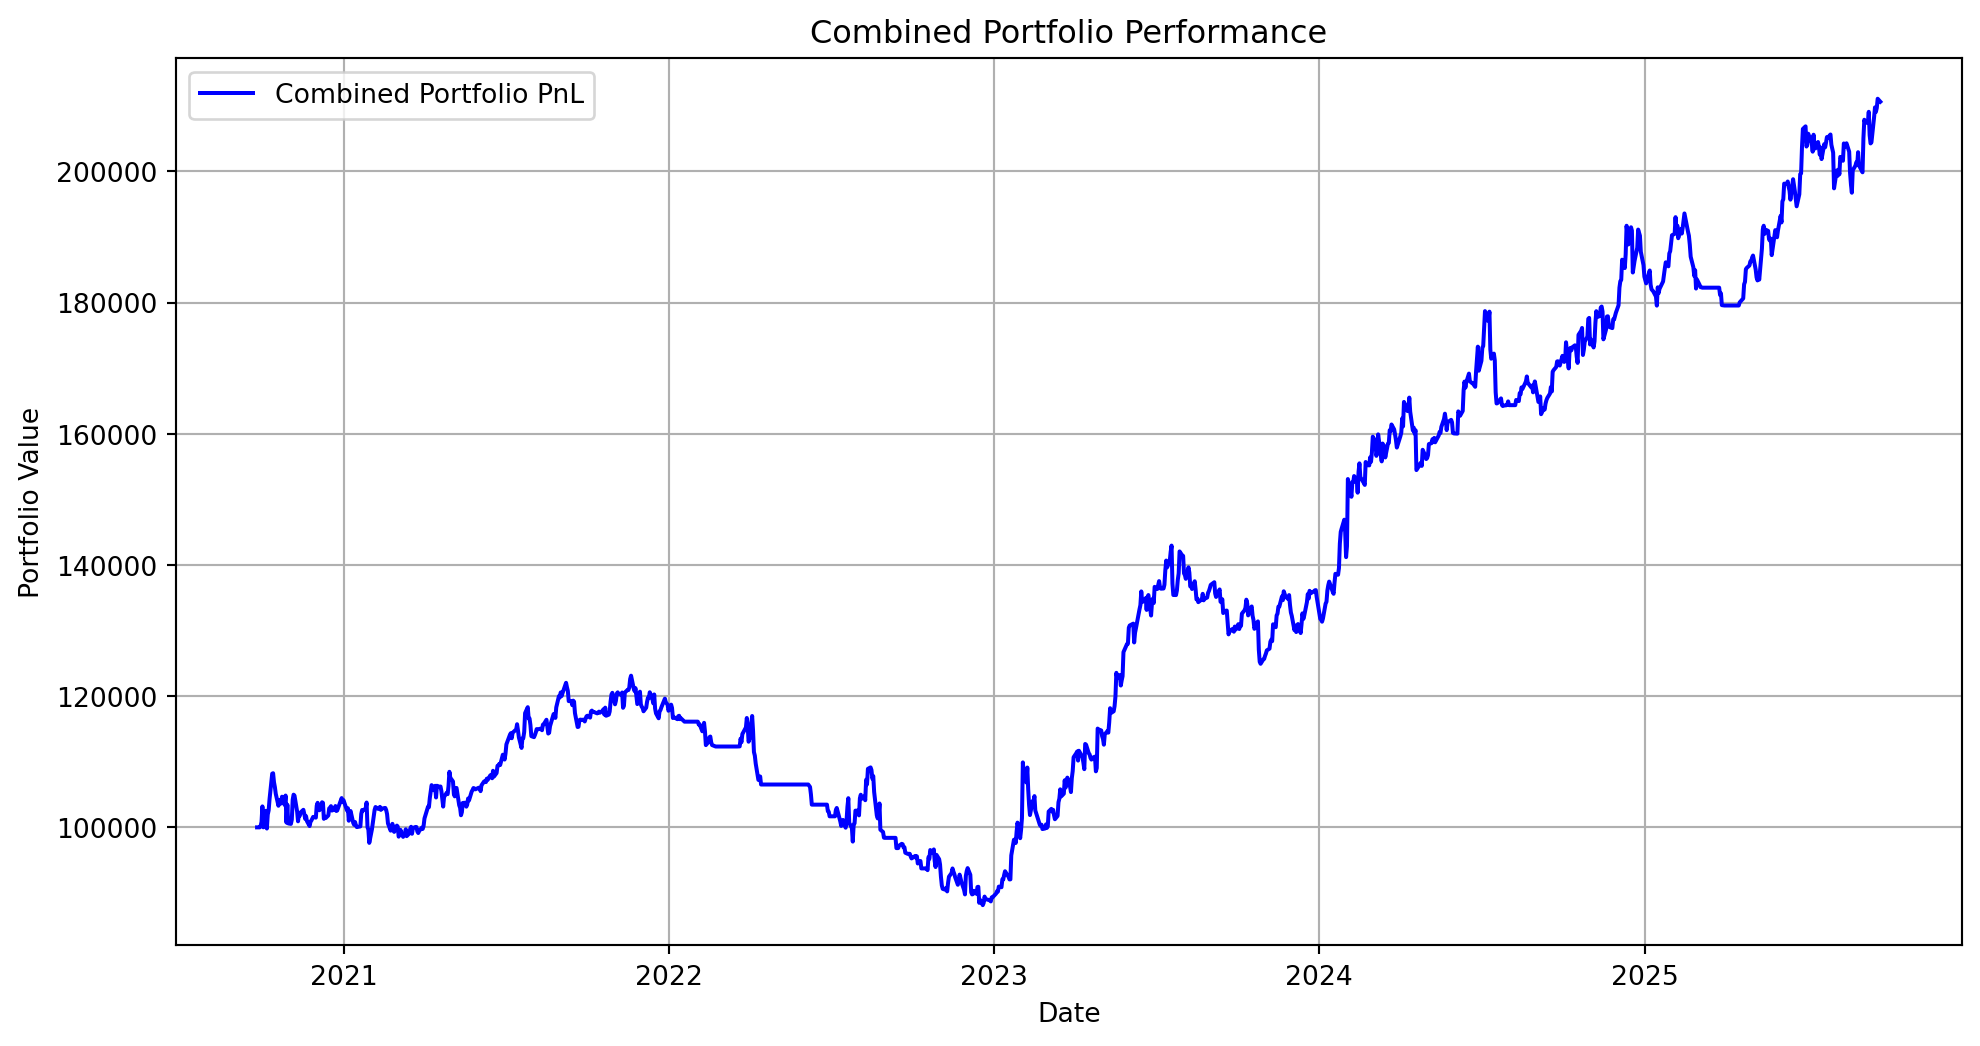
The tryout version of this financial portfolio strategy successfully demonstrates the potential for effective asset selection and risk-adjusted portfolio management. By achieving an annualized return of 44.90% and outstanding Sharpe and Sortino ratios, it reflects strong financial acumen and real-world applicability. This initial version establishes a solid foundation for developing advanced and sophisticated trading strategies in subsequent iterations.
With added layers of complexity, improved machine learning models, and the inclusion of broader financial market data, this project can evolve into a comprehensive framework for data-driven investment decision-making, setting benchmarks for algorithmic trading and portfolio optimization.